Academics
PollPals
Ask the class a question, tap in the answers, and a bar graph draws itself. The tallest bar is the favourite - but before you asked, you didn't know. That's the big idea: data is MADE, not given. Read the graph (which won? how many more?), then make your own in the Bar-graph lab. A tiny, deterministic data game, no internet. Ages 6-8.
▶ Play it nowBuilt for sittings of about 15 minutes on the screen. That is our design budget, not a measurement.

Meet your mentor
Every Spark & Anvil app has a friendly mentor character that demonstrates, asks, and patiently scaffolds learning.
Mentored by Graph
#1f8f8a Characters who teach
Meet the cast
PollPals's crew ARE the steps of a class poll - the cast IS the curriculum: making the data, then reading it. Tallo loves making one mark for every answer, one at a time. Barley turns that tally into bars that grow as tall as their count, so you can see the whole class at a glance. Peaky always points at the tallest bar and names the favourite - and the shortest one too. Askel keeps everyone honest about the one rule that matters most: you can't know the answer until you ASK the class and count, so data is MADE, not given. Graph, the mentor, helps the class read the bars - which won, which was fewest, how many more, and how many in all - and reminds them a poll tells you about the kids you actually asked, not everyone in the world. A first, gentle feel for data-handling (6-8): short words, big buttons, no score. Nothing leaves the device.
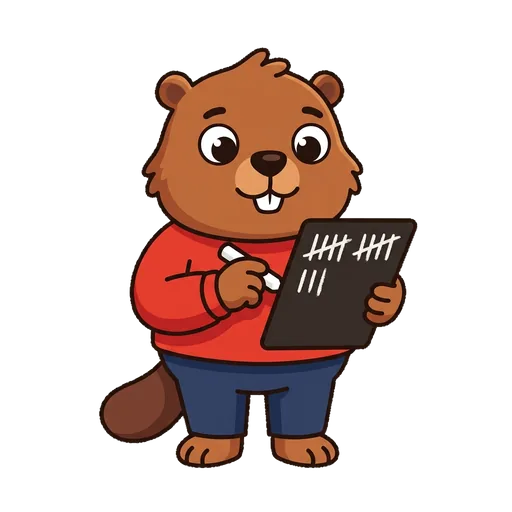
Tallo
The tally-maker - makes one mark for every answer, the first step in turning a question into data
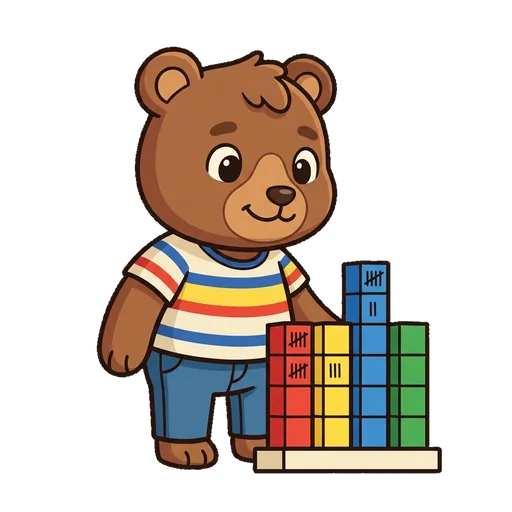
Barley
The bar-builder - turns the tally into bars that grow as tall as their count, so the class is visible at a glance
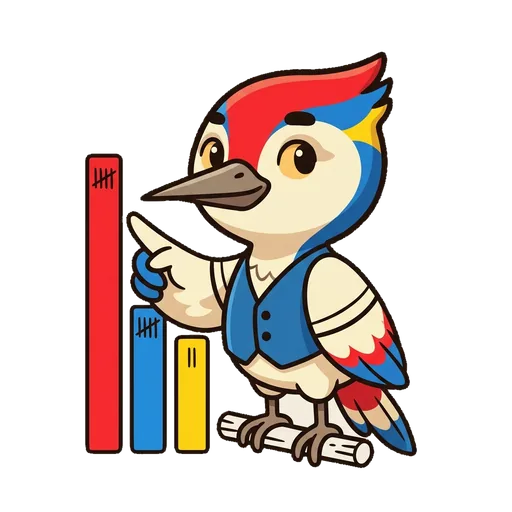
Peaky
The reader - points at the tallest bar (the favourite) and the shortest, and works out how many more one has than another
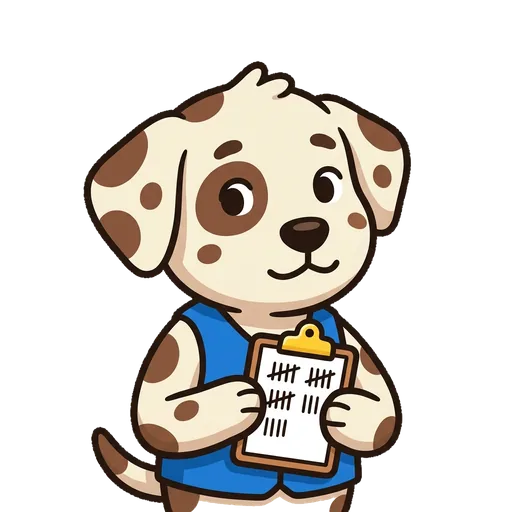
Askel
The one who insists you ASK before you count - the reminder that data is made, not given, and a poll is only about the group you asked
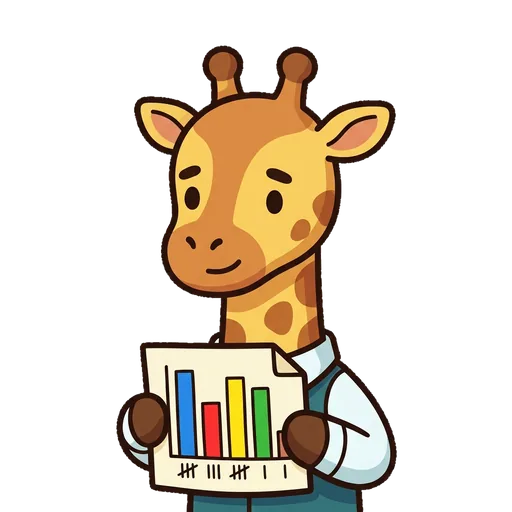
Graph
The guide who helps the class read a bar graph - most, fewest, how many more, and how many in all
What's inside
Learning goal
Ask the class a question, tap in the answers, and a bar graph draws itself. The tallest bar is the favourite - but before you asked, you didn't know. That's the big idea: data is MADE, not given. Read the graph (which won? how many more?), then make your own in the Bar-graph lab. A tiny, deterministic data game, no internet. Ages 6-8.
Mentored by Graph — no data leaves the device.
How PollPals handles your kid's data
- ✅ All progress, settings, and AI-generated content stays on the device
- ✅ No analytics, no tracking, no third-party SDKs
- ✅ Free — no ads, no in-app purchases
- ✅ No personal information collected from children — in line with COPPA (updated by the 2026 FTC amendments)
- ✅ No chat with strangers — play-together rooms use a short code and preset emotes, never typed messages