Graph
DATA VISUALIZATION
Loading audio…
Press play to listen along. The line being read lights up as you go.
Show full transcript
Loading transcript…
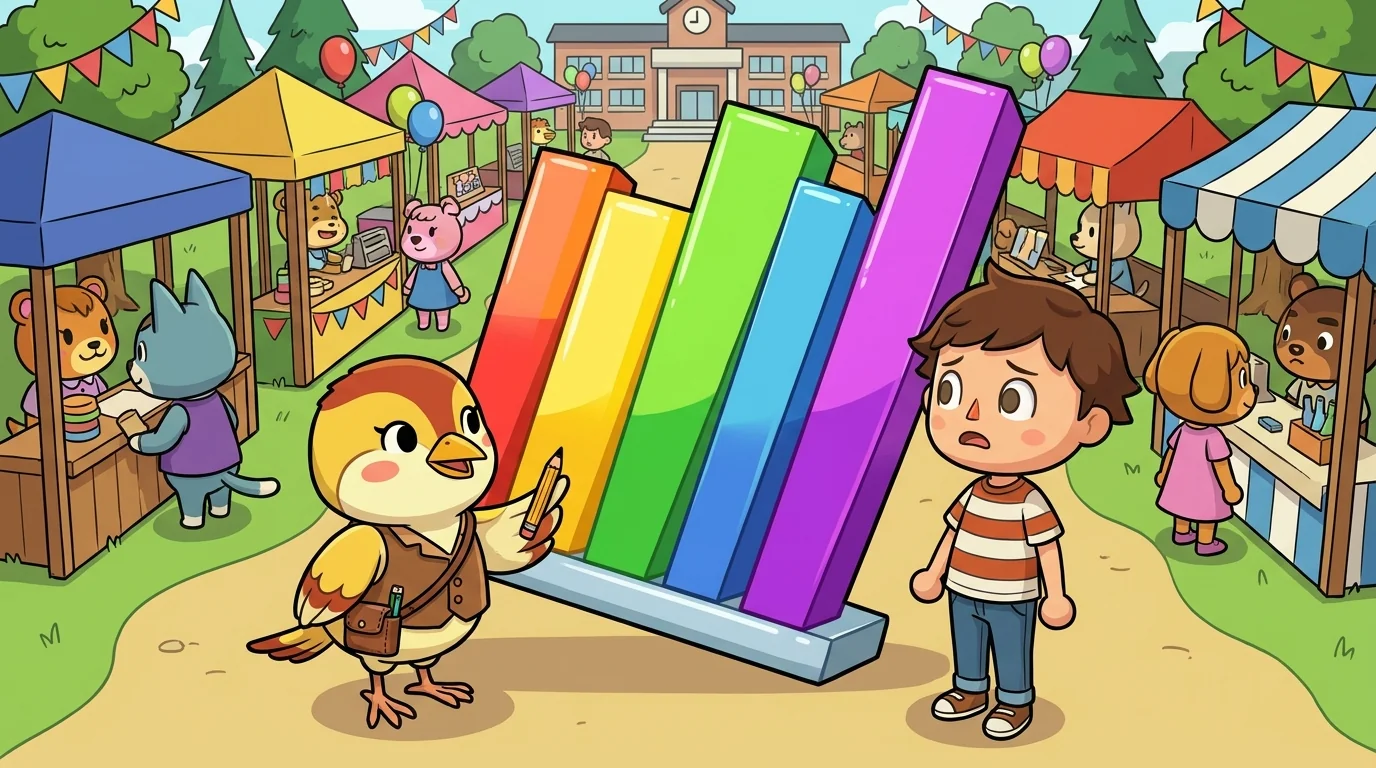
The chart on the wall of the school fair was gorgeous, and Graph could tell in three seconds that it was lying.
She was a finch, small and bright-eyed, with yellow feathers mixed with cream and russet. A little leather case of chart-pencils sat tucked in her vest. She stopped in front of the winning entry: a tall, glossy, three-dimensional bar chart, tilted at an angle, rainbow-colored, that seemed to shout our club grew HUGE this year!
She leaned in and read the tiny numbers along the side. Then she frowned.
"The bottom of this chart doesn't start at zero," she said to the boy standing proudly beside it. "It starts at ninety. So the club going from ninety-two members to ninety-five looks like it tripled." She tilted her head at the 3D tilt. "And the slant makes the front bars look even bigger. Three new members. That's the whole story. The chart's making it look like a hundred."
The boy's face fell. "But it looks amazing."
"It does," Graph agreed. She wasn't unkind about it. "That's the trouble. A chart isn't just a picture — it's saying something to whoever looks at it. This one's saying something that isn't true." She took out her pencils. "Want to make one that looks a little plainer and tells the truth? I'll help."
Something in her settled as she said it — the quiet, sure feeling of picking honesty over flash.

Graph learned that colors and shapes carry meaning long before she learned about charts.
Her family were the quilt-makers of a small village, finches who designed the yearly harvest-quilt. Each square showed what a family had given to the shared stores that year — grain, wool, apples — and the colors were chosen to honor what was true.
When Graph was six, she wanted to make her square with every color in the basket, all at once, because it would be the prettiest. Her grandmother gently stopped her hand.
"A square that's all rainbow says nothing," her grandmother said. "Nobody reading the quilt will know what your family gave." She laid out three careful colors instead — gold for grain, gray for wool, red for apples. "A quilt with meaningful colors becomes a treasure the whole village trusts. A quilt with random flashy ones is just noise on a blanket."
Graph looked at the two versions — her rainbow scribble and her grandmother's honest three colors. The plain one told a true story. The pretty one told nothing.
"So the prettiest isn't the best," she said.
"The truest is the best," her grandmother said. "If you can make the truest one lovely too, that's the real skill. But truth comes first. Then beauty."

When she was grown, Graph walked to the DataForge academy with her chart-pencil case in her vest.
A young apprentice met her at the first bench. "Can you show me how you'd tell a story from numbers?" the apprentice asked.
Graph didn't recite a list. She pulled out a folded card — bar, line, scatter, pie, histogram, box-plot, heatmap, map — and set it beside a small pile of numbers on the workbench.
"First I look at the shape of what's here," she said. "Is it groups I'm comparing? Then a bar. Is it a thing changing over time? A line. Two things that rise and fall together? A scatter." She tapped the card. "The data has a shape, and the shape tells you which chart is honest. I never pick the flashiest one. I pick the one that fits — and then I make that one as clear as I can."
The apprentice studied the card and the numbers. "And when the pretty choice and the honest choice pull apart?"
"Honest wins," Graph said simply. "Every time."
The apprentice nodded and pulled up a stool. "Then sit down and teach us that."

In Graph's workshop, a girl named Sorrel brought her a pie chart she'd made of how her class spent recess. It had eleven thin, colorful slices, and it was very hard to read.
"It's so colorful," Sorrel said, a little unsure, "but nobody can tell what it means."
"Let's find the shape of your story," Graph said kindly. "What are you actually showing?"
"How many kids do each recess thing. Soccer, reading, swings, tag..."
"Are those parts of one whole that add up to everyone?"
"Sort of. But some kids do two things."
Graph smiled. "Then it's not really a pie — pie charts only tell the truth when the slices add up to exactly one whole, once each." She turned Sorrel's chart over to the blank side. "You've got groups you're comparing — soccer kids, reading kids, swing kids. What shape is that?"
Sorrel checked the folded card. "...Bars?"
"Bars," Graph agreed. "One bar per activity, all starting at zero, tallest to shortest. Suddenly anyone can see it in a heartbeat." She handed Sorrel a pencil. "And label everything — what each side means, where the numbers came from, how many kids you counted. A good chart tells the reader everything they need, and hides nothing."
Sorrel drew the bars. The messy rainbow pie became a clean, plain, readable thing — and for the first time you could actually see the answer.

Sorrel looked at her two charts side by side: the flashy one, and the plain honest one. "The first was prettier," she said, a little wistful.
"It was," Graph said. "I still make pretty-but-wrong ones sometimes. That's how I learn — the moment the flashy thing and the honest thing pull apart, I choose honest and start over. It's just practice." She tapped the clean bar chart. "This one's beautiful in a different way. It's beautiful because it's true. Nobody looking at it will be fooled."
Then she closed her chart-pencil case, and a warm, steady gladness settled in her chest — the good feeling of having shown the truth plainly. The next pile of numbers waited, and Graph felt calm and quietly happy, unworried, ready to be honest all over again.
Hear it as an audio drama
A short play starring Graph, from DataForge. Different voices, same idea. Listen any time after you read.
Loading audio…
Read the drama script
- Narrator: From Spark and Anvil and DataForge — this is Graph, in chapter 1 of the DataForge cast.
- Narrator: This drama uses an AI-generated voice. Voiced via Gemini 2.5.
- Narrator: This story covers data, fairness, and bias. Parents may want to listen first.
- Narrator: Graph is a tiny finch, streaked with russet. From her vest, she pulls a case of colored pencils and a small card listing chart types: bar, line, scatter, pie.
- Narrator: She chooses the right tool for the data's shape, then draws the chart, picking a color to match the data's mood. This is her science.
- Graph: To compare apples versus oranges, you use a bar chart for categories. To show change over a school year, you need a line chart for time.
- Graph: The chart IS an argument. Every choice you make claims something about the data. The chart that tells the truth is not always the loudest one.
- Narrator: Graph grew up in a village of quilt-makers. Each square on their harvest-quilts showed data, with colors chosen to honor the truth of the village.
- Graph: My grandmother taught me. A quilt with flashy, arbitrary colors won't be trusted. But one whose colors carry real meaning becomes an heirloom.
- Narrator: She walked to the DataForge academy at twenty-two. The headmaster asked her one question: What is data visualization?
- Graph: It is the shape of the story. The chart that tells the truth is not the loudest one. It is the one that matches the data's own form.
- Narrator: The headmaster smiled, a slow blink of his wise old eyes. Graph was appointed to her post on the spot.
- Graph: Bar for categories. Line for time. Scatter for relationships. Each chart has a job. Your job is to pick the chart that fits.
- Narrator: Match the chart to the data's shape. That is what makes visualization honest.
- Narrator: You've been listening to a Spark and Anvil chapter, written by the Spark and Anvil writing team for ages 9 to 14.
- Narrator: Apps stay free forever.
- Narrator: Curriculum aligned to Computer Science Teachers Association and statistics standards.
- Narrator: If anything in this story brought up big feelings, talking to a trusted adult helps. You can also reach support lines anytime.
- Narrator: Released under Creative Commons BY-NC-SA 4.0 for educational reuse. Visit Spark and Anvil for the full transcript.
The DataForge ensemble
Graph is one of the friends in DataForge. Each friend shows you one idea by how they act; meet them all and you have the whole subject.
-

Catch
Data collection — who-what-why-when posture (every dataset has a collector + purpose + omissions)
-

Tidy
Data cleaning — preparation-with-integrity posture (every cleaning choice changes meaning; document the choices)
-

Tell
Interpretation — correlation-not-causation posture (data shows patterns; humans interpret; confidence not certainty)
-

Guard
Data ethics — bias-privacy-harm-consent posture (who benefits, who's harmed, who decided; structurally present in every kit from kit 6)
-

Crux
Summary — honest-middle posture (which middle tells the truth: mean, median, or mode; one giant value drags the average away from where most of the crowd actually sits)
-
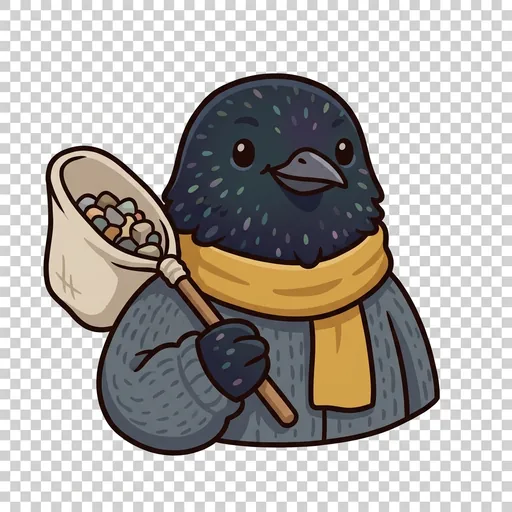
Cull
Representative sampling — fair-sample posture (a sample must mirror the whole; who gets left out silently bends the story)
-

Ladle
Rates & fair comparison — like-for-like posture (compare rates and fair portions, not raw totals; a bigger pot isn't a bigger share)
-
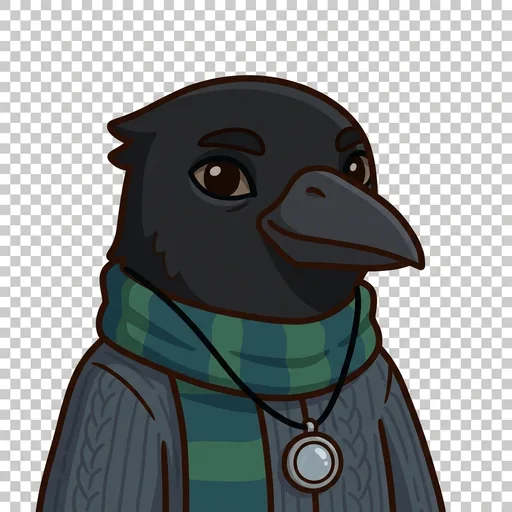
Stray
Reading the outlier — the-one-that-doesn't-fit posture (an outlier is a question to ask, not noise to delete; find out why before you drop it)
-
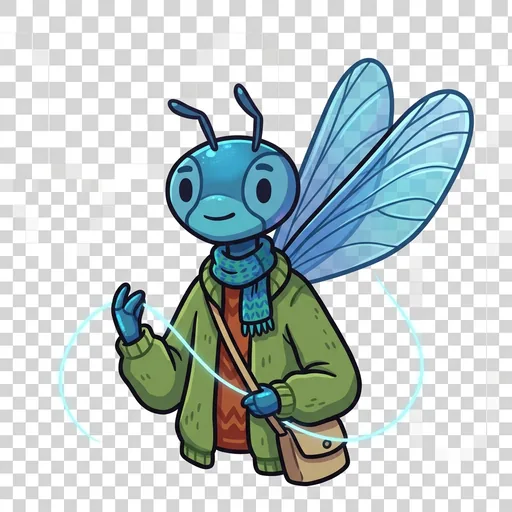
Waver
Uncertainty & margin — confidence-not-certainty posture (every estimate carries a margin of error; show the wobble honestly instead of hiding it)