STEM
DataForge
Visual, block-based data science environment where players collect, clean, analyze, and visualize real-world datasets. No coding required — drag-and-drop data pipeline builder.

Meet your mentor
Every Spark & Anvil app has a friendly mentor character that demonstrates, praises, and patiently scaffolds learning. On-device AI personalizes the mentor's responses to your kid's progress — never connecting to a server, never collecting data.
Mentored by Datum
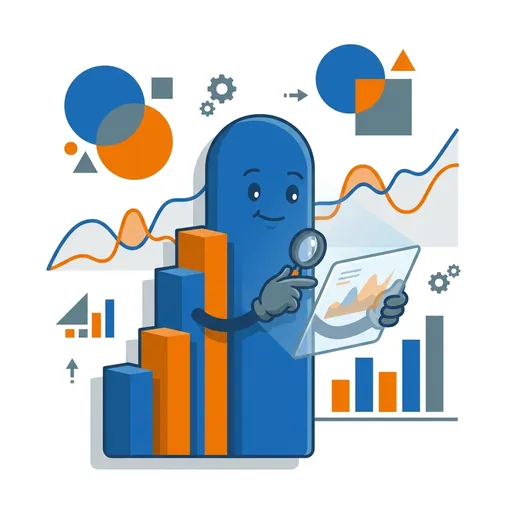
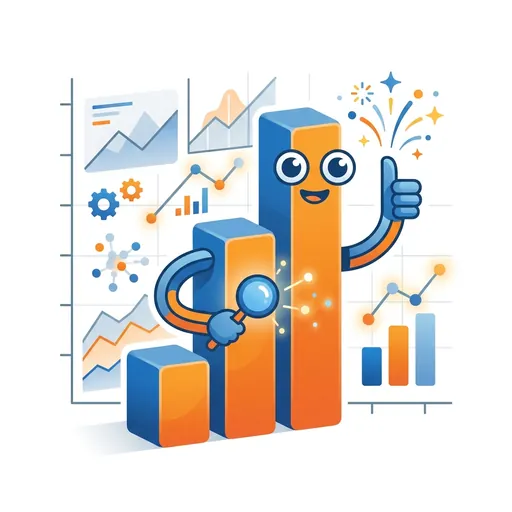
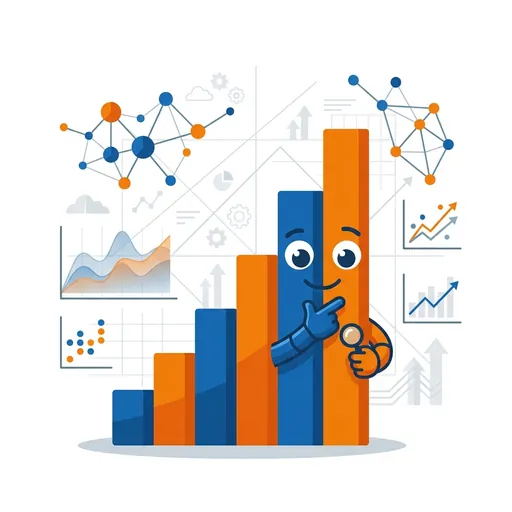
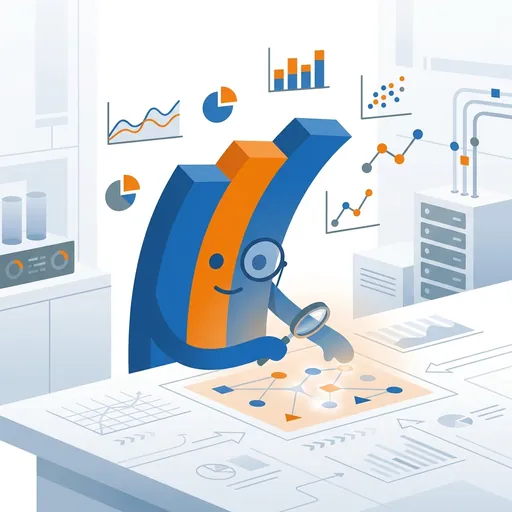
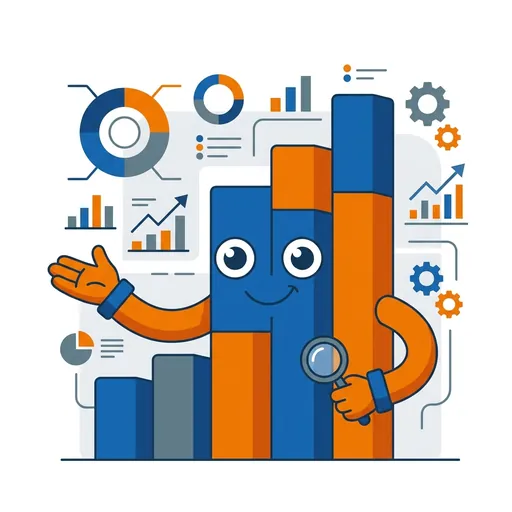
#29B6F6 DataForge is a data science playground where you explore real-world information! Build data pipelines by connecting blocks, create colorful charts and graphs, and test your ideas about what the data means. Think of it as building with blocks, but instead of towers, you build discoveries.
Distributed-narrative cast
Meet the cast
DataForge's 5-character cast embodies the foundational data-pipeline primitives — collection (Catch, who/what/why/when), cleaning (Tidy, documented choices), visualization (Graph, shape-of-the-story), interpretation (Tell, correlation-vs-causation), and ethics (Guard, bias-privacy-harm-consent — structurally present in every kit from kit 6 onward). Datum (mentor; renamed from 'Data' to resolve mentor-vs-curriculum collision per brief — Latin singular 'one data point' carries humility + ethics-foregrounding) frames each primitive; cast embodies them at school-data-club / community-data-journalism scale. Data-ethics gate enforced (CRITICAL): cast NEVER frames data collection as neutral; foregrounds 'data is collected by someone, for a purpose'; bias enters at every step; cross-app-ethics register from AIForge (mandatory Stake-Guard + Feed-Catch coordination).

Catch
Data collection — who-what-why-when posture (every dataset has a collector + purpose + omissions)
Read chapter →

Tidy
Data cleaning — preparation-with-integrity posture (every cleaning choice changes meaning; document the choices)
Read chapter →

Graph
Data visualization — shape-of-the-story posture (which chart tells the truth, not the loudest one)
Read chapter →

Tell
Interpretation — correlation-not-causation posture (data shows patterns; humans interpret; confidence not certainty)
Read chapter →

Guard
Data ethics — bias-privacy-harm-consent posture (who benefits, who's harmed, who decided; structurally present in every kit from kit 6)
Read chapter →

Crux
Summary — honest-middle posture (which middle tells the truth: mean, median, or mode; one giant value drags the average away from where most of the crowd actually sits)
Read chapter →

Cull
Representative sampling — fair-sample posture (a sample must mirror the whole; who gets left out silently bends the story)
Read chapter →

Ladle
Rates & fair comparison — like-for-like posture (compare rates and fair portions, not raw totals; a bigger pot isn't a bigger share)
Read chapter →

Stray
Reading the outlier — the-one-that-doesn't-fit posture (an outlier is a question to ask, not noise to delete; find out why before you drop it)
Read chapter →

Waver
Uncertainty & margin — confidence-not-certainty posture (every estimate carries a margin of error; show the wobble honestly instead of hiding it)
Read chapter →
Browse all chapters → · What's distributed-narrative methodology? →
What's inside
Pipeline Builder
Drag data blocks onto the canvas and connect them. Start with a dataset block (your information), add filter blocks (to focus on what matters), and finish with
Datasets
Explore real-world datasets about topics like weather, animals, sports, and more. Each dataset is a collection of facts waiting for you to discover patterns.
Charts and Graphs
Turn numbers into pictures! Create bar charts, line graphs, pie charts, and scatter plots. The right chart can reveal patterns that are hidden in raw numbers.
Hypothesis Testing
Make a guess about what the data will show, then build a pipeline to test it. Were you right? Either way, you learn something new!
Mentored by Datum — on-device AI, no data leaves the device.
How DataForge handles your kid's data
- ✅ All progress, settings, and AI-generated content stays on the device
- ✅ No analytics, no tracking, no third-party SDKs
- ✅ No ads, no in-app purchases — you pay once
- ✅ COPPA compliant under the 2026 FTC amendments
- ✅ Parental controls + session limits + content filters built in
DataForge runs on ForgeKit — the open-source Swift Package Manager framework that powers every Spark & Anvil app. ForgeKit ensures consistent accessibility, COPPA compliance, and design language across the portfolio, so your kid's progress and preferences feel coherent across every app they touch.
Coming to the App Store
DataForge is in active development. Email us to hear when it ships — no marketing, no spam, just a one-shot launch announcement.
Email me at launch

