Before you start
Most popular
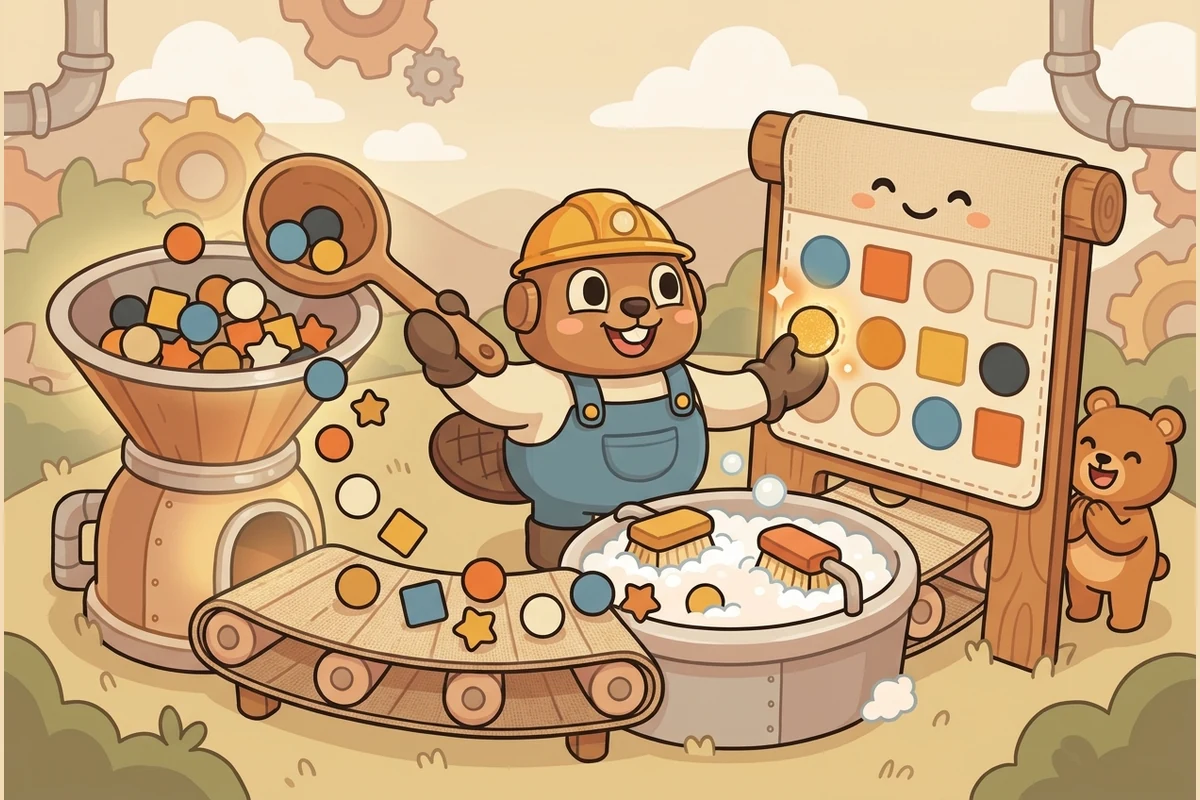 Pipeline Studio Chain blocks — filter, sort, group, chart — over a real dataset and watch the story appear.
  Which Average? Predict the mean of a dataset — then watch it balance on a dot plot. Don’t get caught reporting the median, mode, or midrange.
 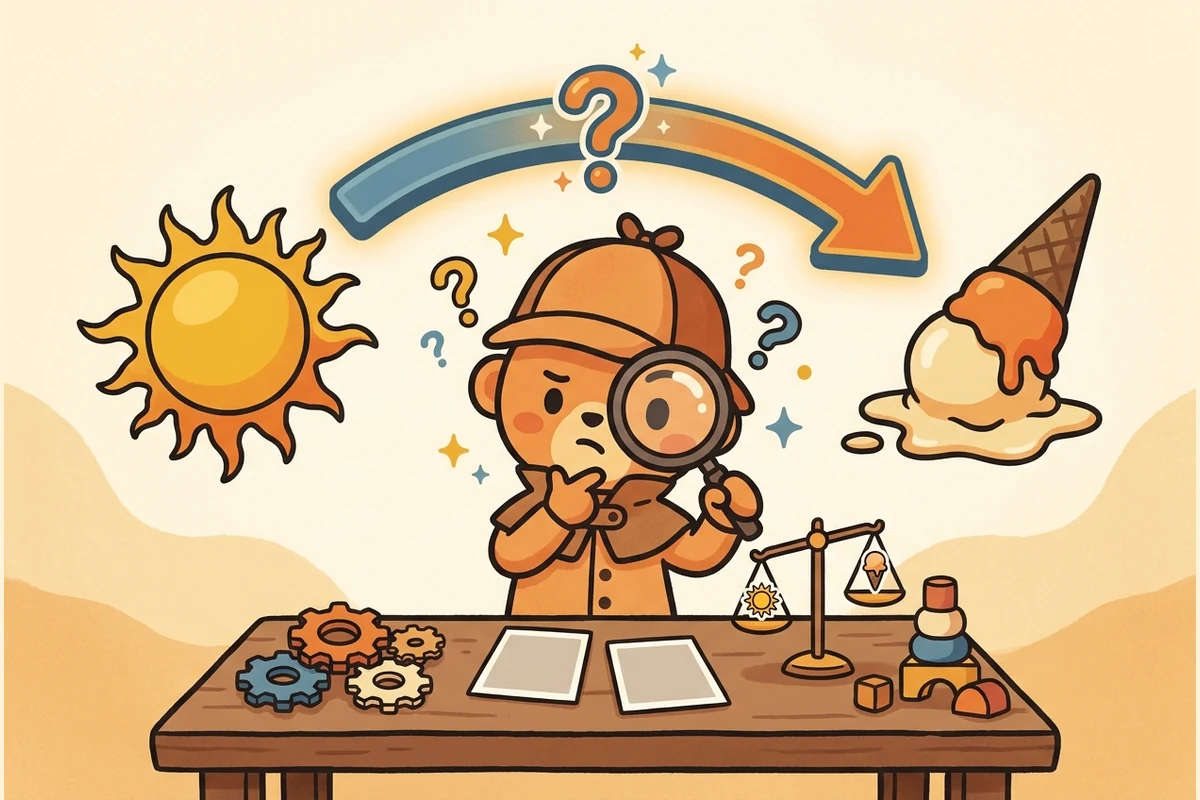 Causation Detective Two things go up together — but does one cause the other? A hidden factor, reverse direction, coincidence, or a genuine cause?
  Data Duel A head-to-head kit round for 2–4 players — one device or an online room by code. Highest first-try score wins.
 All activities
Work with real data
Pipeline Studio Chain filter, sort, group, and chart blocks over a real dataset and watch the story appear. Tidy the Data Real data is messy. Spot the flawed cells — impossible values, wrong units, blanks, duplicates — clean them, and watch the chart tell the true story. Which Average? Predict the mean, then watch it balance on a dot plot — don’t confuse it with median, mode, or midrange. How Spread Out? Same range, different spread — predict which dataset is more spread out, then two dot plots reveal it. Hypothesis Lab Predict a statistic first — then the data reveals the real answer. Commit before you see it. Reading Charts Spot what makes a chart misleading — a squashed scale, the wrong chart type, or a cherry-picked slice. Causation Detective Does one thing cause the other? A hidden third factor, reverse direction, coincidence, or a genuine cause.
Practice & play
Choose a kit
All 16 kits
Kit 1: Data Types & Collection Kit 2: Graphs & Charts Kit 3: Mean, Median & Mode Kit 4: Probability Basics Kit 5: Data Distributions Kit 6: Statistical Questions Kit 7: Data Analysis Kit 8: Intro to Coding with Data Kit 9: Data Cleaning & Preparation Kit 10: Correlation & Causation Kit 11: Data Visualization Best Practices Kit 12: Intro to Machine Learning with Data Kit 13: Cross-Topic Connections Kit 14: Real-World Applications Kit 15: Misconceptions & Reasoning Kit 16: Advanced Synthesis
For grown-ups — progress report →
More ways to play
Same idea, another world
😄 Brain break

Meet the cast — the characters who teach this
-
 Catch Data collection — who-what-why-when posture (every dataset has a collector + purpose + omissions)
 -
 Tidy Data cleaning — preparation-with-integrity posture (every cleaning choice changes meaning; document the choices)
 -
 Graph Data visualization — shape-of-the-story posture (which chart tells the truth, not the loudest one)
 -
 Tell Interpretation — correlation-not-causation posture (data shows patterns; humans interpret; confidence not certainty)
 -
 Guard Data ethics — bias-privacy-harm-consent posture (who benefits, who's harmed, who decided; structurally present in every kit from kit 6)
 -
 Crux Summary — honest-middle posture (which middle tells the truth: mean, median, or mode; one giant value drags the average away from where most of the crowd actually sits)
 -
 Cull Representative sampling — fair-sample posture (a sample must mirror the whole; who gets left out silently bends the story)
 -
 Ladle Rates & fair comparison — like-for-like posture (compare rates and fair portions, not raw totals; a bigger pot isn't a bigger share)
 -
 Stray Reading the outlier — the-one-that-doesn't-fit posture (an outlier is a question to ask, not noise to delete; find out why before you drop it)
 -
 Waver Uncertainty & margin — confidence-not-certainty posture (every estimate carries a margin of error; show the wobble honestly instead of hiding it)
Ensemble stories — the cast together